Custom Genotyping
Custom Genotyping and Comment Page
What is custom genotyping?
The genotyping base on whole-genome sequencing of population is affected by two main factors, the type of variation (SNP and InDel) and the number of variation.
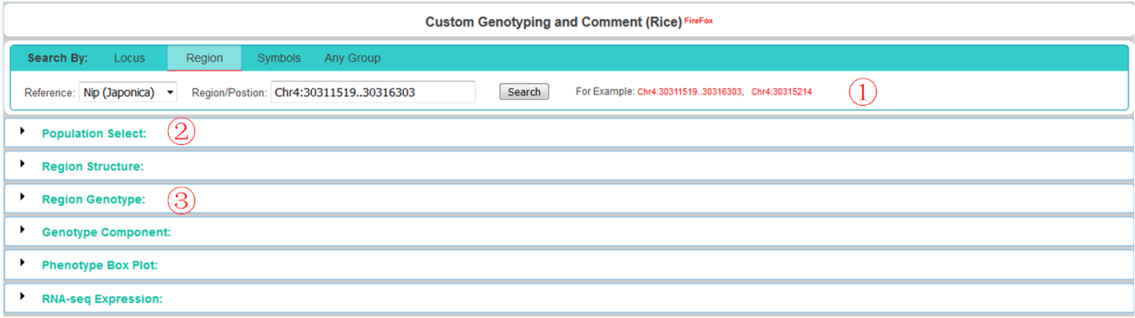
In custom genotyping page, all related parameters can be user-defined settings.
① control the query region:
you can set the upstream and downstream of a locus.
you can choose any region or a position on the genome to query and genotyping, but no more than 20kb.
you can set up the query combination of any region or position, but total length no more than 20kb.
② control the population:
select population by project and ecotype or filtered by pheontype or select from phylogenetic tree, detail see below "Population Selection".
③ control the ALT:
select variation type or filter variation by allele frequency, missing%, depth, quality, and so on.
after genotyping, you can choose the combination of any variation position for recall genotype, detail see below "Region Structure and Genotype".
Population Select

This population selcet module provides three methods of filtering:
① select population according to project sources, the type of subgroup, and the quality of sample sequencing and mapping.
② filter population through specific phenotype characteristics, click "Show Filter" button will show the phenotype filter tool, detail see below.
③ select population from phylogenetic tree, detail see below.
② Filter population by phenotype:
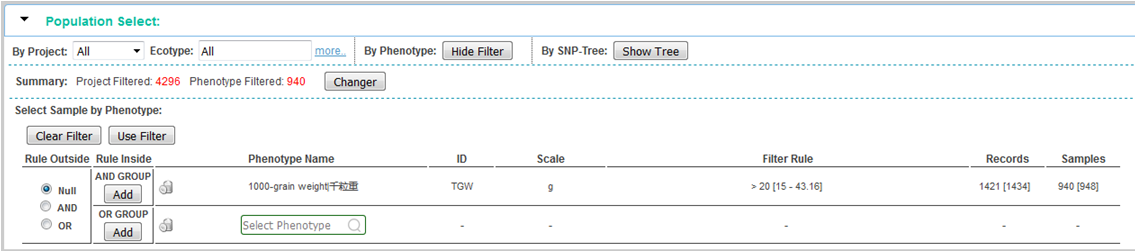
step 1, show the tools of phenotype filter by click "Show Filter" button
step 2, select phenotype and set filter rule, click "Add" button to add new filer rule in corresponding "Rule Inside“, set ”Rule Outside“ if need be.
step 3, click "Use Filter" button will apply all filter rules, the filtered sample number will display in the summary.
step 4, click "Changer" button, intersection of filtered population will be use for genotyping.
③: Select population from SNP-Tree:
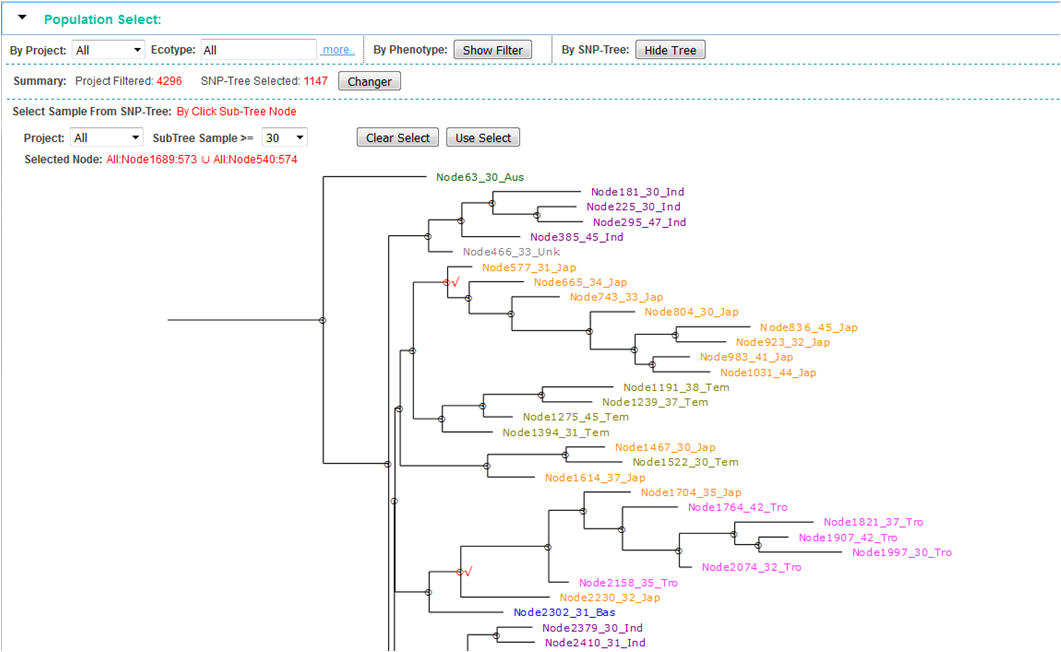
step 1, show SNP-Tree by click "Show Tree " button
step 2, click parent-node in the tree, and all leaf-node (sample) will be selected. The parent-node be marked with "√", and click again to deselect.
step 3, confirm selection by click "Use Select" button, and the number of selected sample will display in the summary.
step 4, click "Changer" button, the intersection of all filtered population will use for genotyping.
Region Structure and Genotype
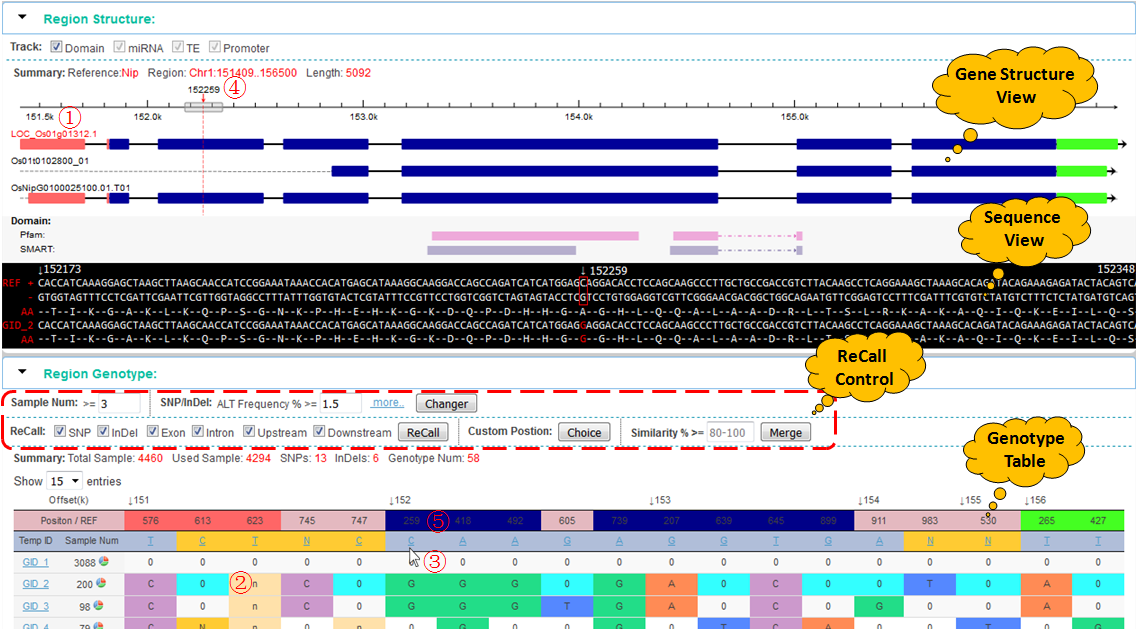
This module is used to show gene structure and other annotation stracks (now, only domain track). Mouse hovering over a rectangular structure will show detailed information of this part.
Query genotype using the locus id (ex. LOC_Os01g01280), will only show this locus in the gene structure view. If query using the region (ex. Chr1:134291..135685), all locus will be show in the view (above).
A typical eukaryotic gene including 5'UTR (orange), exon (blue), intron and 3'UTR (green). Click and select a mRNA (①), the coding amino acid sequence will be displayed in sequence view window with black background ( REF, reference DNA sequences. AA, amino acid sequences ). Meanwhile, the background color of position row in genotype table (③) is also corresponding to change. So that it is easily to detect the mutations which took place in exons.
How predict the effect of genotypes compare with the reference protein's function?
step ①, click mRNA ID in gene structure view to select one protein as a reference. This reference sequence will be displayed in sequence view.
step ②, click genotype row that you want to analyze in genotype table. The genotype contain a set of SNP and InDel, the effect of these variations be analyzed as an whole, not a separate. Modified amino acid sequence will display corresponding in the sequence view.
step ③, click variation sites that you want to check in the position row, Ex. click position 295 (152259), the sequence window and chromosome cursor will automatically jump to the corresponding position, As shown, this mutation resulted in the substitution of amino acids (A→G).
step ④, drag the cursor chromosomes, can view the other position change of amino acid sequence.
How to use the custom ALT control?

There are two row parameters in this control tools panel:
The first row's parameters will be submitted to the server when click the "Changer" button, and the new genotypes are generated in background using custome genotyping pipeline.
The second row's parameters take effeck only at foreground, use for recall gerotype.
ALT%, sum of all alternative allele frequency.
ALT% = AC / AN, when 'Small' be checked in ALT population radio button
ALT% = AC / (sample_num * 2), when 'Big' be checked in ALT population radio button
Missing%, ALT missing frequency.
Missing% = missing_num / sample_num
Cluster Filltered, be use for filtering the cluster variations in windows 10 bases.
ALT Depth and Quality, be use for filtering the low quality ALT.
How to add verified functional comment for a variation?
A proven mutations must have corresponding experimental evidence or WAGS results support, and the different alleles must have obvious differences in phenotype.
We welcome website user and the author of the study to submit the annotation of relevant variation, the annotation are open, but the annotation will be manually checked by website manager, and the checked variations will be listed in the KnownGenes home page.
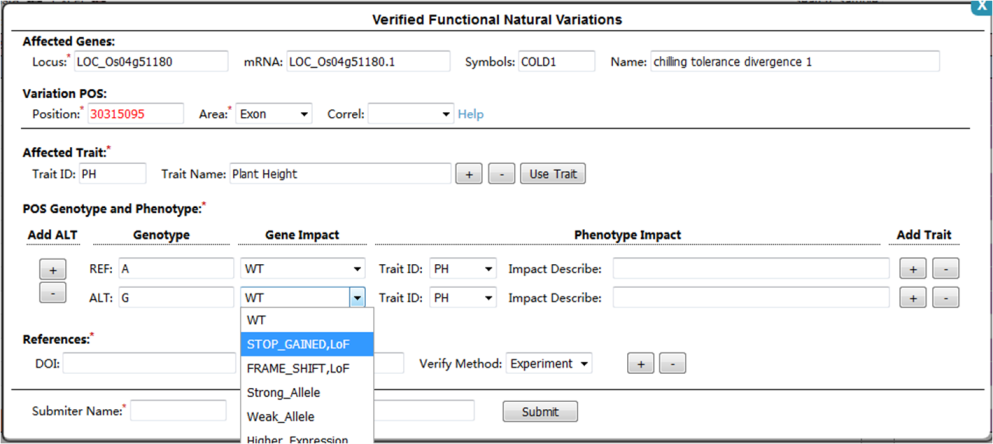
step 1, click variation position in genotype table (⑤) will pop the comments page (below), a annotated position will be marked with red color font.
step 2, select or input the affected genes information.
step 3, add affected trait by input trait ID or name, the system will automatically provide the phenotype list for choice which collected in database.
step 4, select or input the genotype, gene type and phenotype impact.
step 5, add references, submiter infomation and submit.
Phenotype Box Plot
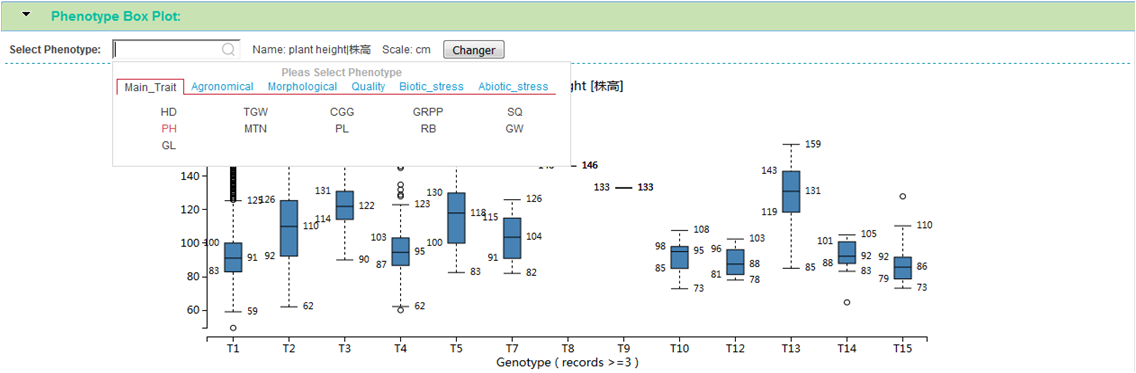
This module shows the relationship between genotype and phenotype using box plot. You can choose interested phenotype from the floating menu, and click changer button to get new relationship analysis.
For each genotype, move mouse over on the box will show detail number of sample and values. One view only show 15 genotypes (T1 - T15), other genotype will co-movement display when click next page in above genotype table.
RNA-seq Expression
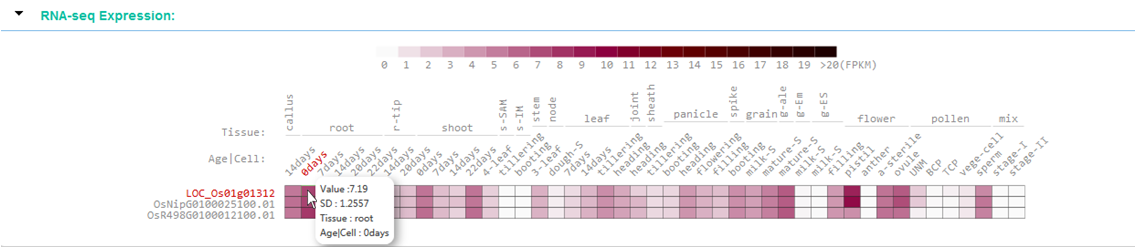
This module display the gene(mRNA) expression profiles of query region, the values come from more than 1750 RNA-Seq datasets that collected from NCBI, and those datasets belong to different tissue and development stage.
Created with the Personal Edition of HelpNDoc: News and information about help authoring tools and software