| Search Locus Genotype | |||||||||||||||||||||
|
|
||||||||||||||||||||
| Browse SNP/InDel | Browse Locus |
|
|
|
 Browse List:
 SNP/InDel:
 Reference Genome
| Locus and SNP/InDel: | Annotation Venn: | ||||||||||||||||||||||||||||||||||||||||||||||||||||||||||||||||||||||||||||||||||||||||||||||||||||||||||||||||||||||||||||||||||||||||||
a Oryza sativa reference genome:
(1) Nip (Nipponbare) Japonica subspecies, Os-Nipponbare-Reference-IRGSP-1.0 (2) R498 (ShuHui498) Indica subspecies, Os-R498-1.0
b
Both Nip and R498 genes were annotated using the Gramene-pipeline evidence-based gene prediction method (doi:10.1101/gr.088997.108.).
The annotations were named as MBK V3 (version 3) in MBKBase.
c
The WGS samples were mapped to Nip and R498 reference genomes for calling SNP and InDel. The SNPs (MAF >= 0.01) and InDels (MAF >= 0.005) were summarized.
|
|
||||||||||||||||||||||||||||||||||||||||||||||||||||||||||||||||||||||||||||||||||||||||||||||||||||||||||||||||||||||||||||||||||||||||||
| Locus Model for Genotyping: | Locus Statistics: |
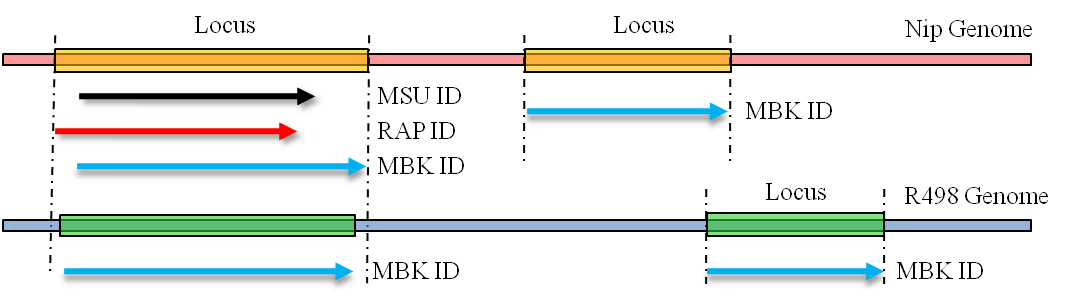
When a locus containsmore than one gene models, different annotations for the same genome can have different boundaries on the same gene. The overlapping annotations were also integrated under the same Locus ID.
|
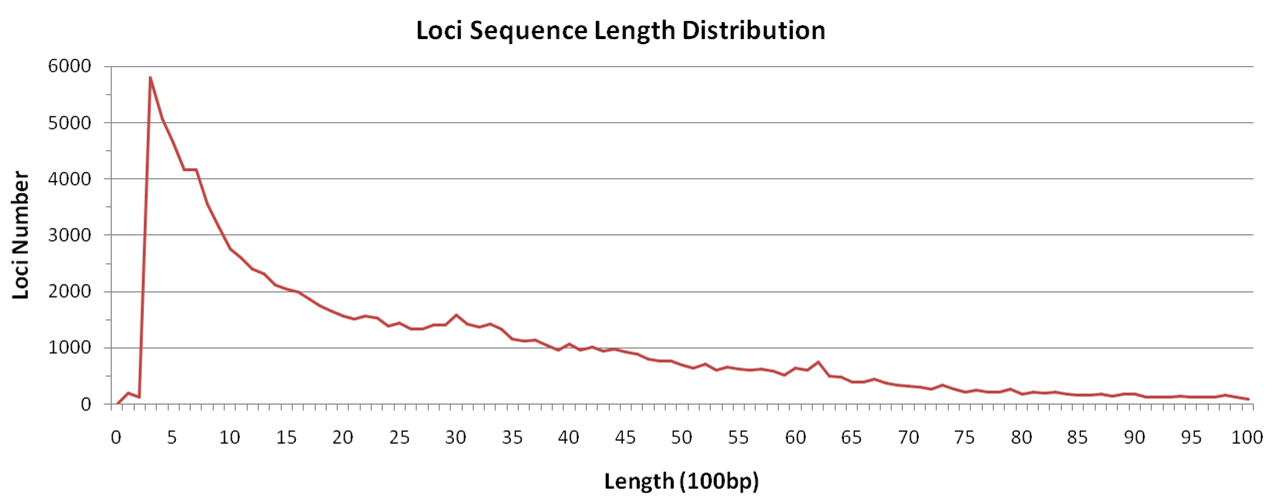
There are totally 95,325 loci for both Nip and R498 genome, with an average length of 3kb. 97% of loci sequences are shorter than 10kb, and 28% shorter than 1kb.
|
| Locus Genotyping and Show: | Genotype Statistics: |
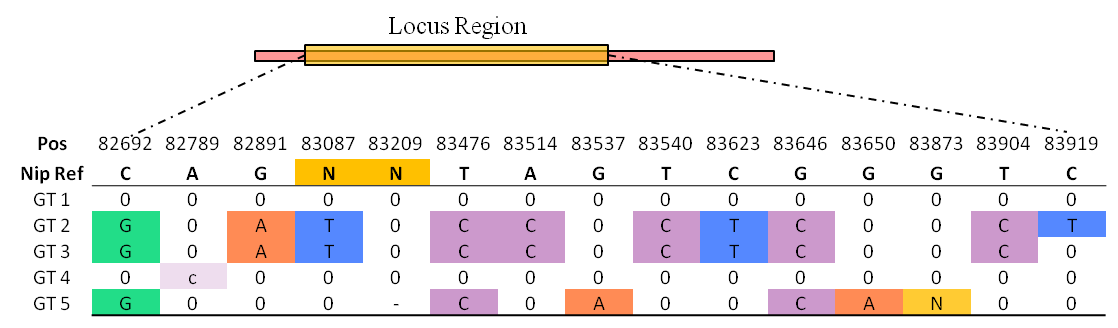
One genotype (GT) is same or differs from the reference sequence (REF), and the differs including both SNP and InDel (ALT).
A Locus GT is an ALT group which located in the region of a gene locus.
All GT be shown in a table, first row is reference genome position, and second row is reference base.
Genotypes are encoded GT1 to GT5, and capital base means homozygous, lowercase means heterozygous, '-' means missing.
In table, charts 'N' represents multiple continuous bases, which means deletion or insertion.
Most cultivated rice are homozygous, so the genotype is same as the conception of haplotype and allele.
|
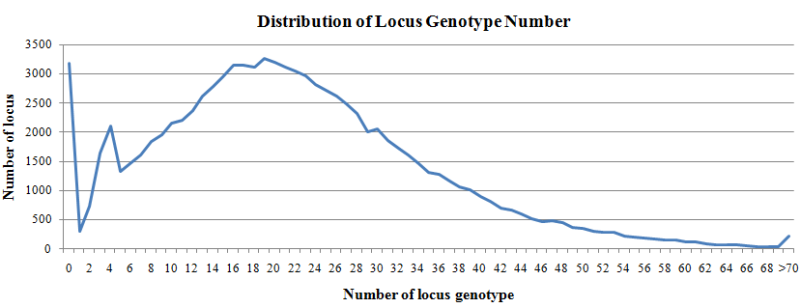
A total of 5280 WGS samples were used to call locus genotype (allele), and the genotype with sample number >=10 were summarized. For each locus, the number of genotypes can represent the number of alleles in the population.
|